Results

Betting Summary August 2014 : Post Origin NRL Bounces Back

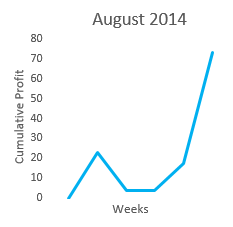
AugustProfitWith the State of Origin series done and dusted for 2014 the NRL finally returned to some normalcy over the month of August and along with it returned my betting profitability. However, results were still a bit volatile since with some teams falling out of finals contention it remained difficult to anticipate whether these teams would fire up with nothing to play for but pride.

There were 5 rounds of football played, though I did give myself a week off in Week 23 as I needed to freshen up. The week off did wonders for me as I recorded my best week of the year during Week 25, though admittedly I got lucky with a few nicely priced wagers it was probably luck that was due to come my way after some horrible fortune that struck me during the coldest months.

The betting results for August 2014 were a little bit mixed, but overall they are positive as my betting performance returned to good form. Below is the weekly summary in table form :-

 Week  Number of Bets  Strike Rate  Net Profit (in units)
 NRL Week 21  35  31.42%  +22.93
 NRL Week 22  41  19.51%  -19.04
 NRL Week 23  0   0.00%   +0.00
 NRL Week 24  38  28.94%  +13.37
 NRL Week 25  39  38.46%  +55.73
 TOTAL  153  29.41%  +72.99

The highlight here is clearly the result in Week 25 which was an abnormally good week primarily due to landing a number of nicely priced Tryscorer bets, but I’m not complaining. Overall the month of August fell just a couple of units short of completely reversing the losses made in June and July so it has been a satisfying bounce back after the difficult State of Origin period and an important return to form heading into the NRL Finals Series.

Looking more closely at the breakdown of betting across market types we have :-

 Market Type  Number of Bets  Strike Rate  Net Profit (in units)
 Match Handicap  20  35.00%  +10.14
 40 Min Handicap  17  52.94%   +1.40
 Margin Bracket   9  22.22%  +13.00
 Match/Team Points  21  47.62%   +8.57
 Points Bracket   3   0.00%   -2.00
 Halftime / Fulltime  10  10.00%   -7.30
 First Scoring Play  17  11.76%  -11.60
 Tryscorers  54  24.07%  +59.57
 Other   2  50.00%   +1.20
 TOTAL  153  29.41%  +72.99

Even though the Tryscorers category is clearly where the bulk of the profit is coming from this month, it is encouraging to see many of the other categories also showing a modest profit. The Margin Bracket category is showing a profit for the first time since early in the season after landing a couple of Halftime Draw bets at 12.00 each and the Match/Team Points category is also in profit for the first time in months primarily due to a change in strategy where I avoided more of the short odds (sub 2.0) and cherry picked for value markets at odds of 2.20 to 3.50 so that when I am right about points I am getting better payouts. I also had better success with betting on Team Points (even for just a 40 minute period) than Total Match Points.

On the flip side, I tried a new strategy with the 1st Scoring Play markets to try and take the underdog for a Try as 1st Score at odds of 2.50+ but this mostly backfired. I landed a couple so I am not totally convinced it’s a failed strategy as it still performed better than backing penalty goals which is a strategy that worked early in the season but I think that has died off as the season progresses and teams get more confident with their attacking options. I’ll need to do some deeper analysis here.

The Halftime/Fulltime category was also a disappointing result for the second month in a row. I’ll need to have a closer look at my strategy here too as late season fatigue could be affecting teams ability to mount comebacks after half time. It also could be related to the fact that some teams are dropping out of contention this time of year and not showing the sort of early game intensity you can generally rely on earlier in the season.

For any more detailed analysis of my betting performance in August, feel free to check out my Facebook Page where all of my bets have been posted prior to kickoff. Or, if you would like to ask any specific questions about my August betting, please write to me at phantomlongshot@flameburst.com

Betting Summary July 2014 : Disasterous month for NRL

JulyProfitAnother short month of NRL football with only 4 rounds played and broken up by State of Origin 3 has turned out to be a very poor month for betting. With State of Origin out of the way and players back into their club teams mid-month it was expected that the NRL would return to some normalcy, but the competition has continued to be unpredictable. No doubt some players and teams are struggling with fatigue and don’t seem able to put in consistent performances. Possibly this is related to the increased physicality and injury toll from this years State of Origin series.

The biggest challenge this month has been figuring out which teams are going to “show up” on any given day and perform. Most teams in the competition are failing to put in 80 minute performances. Results also haven’t been helped by a sharp deterioration in the quality of refereeing post-origin.

The betting results for July 2014 are showing some sharp losses, making it the worst performing month of 2014 to date. Below is the weekly summary in table form :-

 Week  Number of Bets  Strike Rate  Net Profit (in units)
 NRL Week 17 + Origin 3  31   9.67%  -15.70
 NRL Week 18  27  18.51%   -4.06
 NRL Week 19  29  13.79%  -31.29
 NRL Week 20  33  21.21%   -2.16
 TOTAL  120  15.83%  -53.21

Overall these are consistently poor results, particularly Week 19 which accounts for the bulk of the losses this month. Week 19 was the first full week of NRL football after players had been given a chance to recover from State of Origin. Some players backed up after SOO 3 in Week 18, but all could have been expected to have had decent recovery time ahead of Week 19. Looking deeper into Week 19 results there were a couple of particularly unlucky outcomes that week. 3 games in particular stand out that I can remember quite clearly :-

Brisbane vs Warriors – With 20 minutes to go Warriors are up by 4 and we are sitting pretty good with 2 units on a Brisbane/Warriors Halftime/Fulltime double at 9.30 and only needing 1 more point for the Warriors to collect on a 4 unit Over 10.5 points bet for the 2nd half. Warriors then go on to choke as Dale Copley breaks the game open with 2 tries in 3 minutes for Brisbane and the Warriors don’t score another point – costing a likely 26.4 unit return from those 2 bets. The cruelest twist is that we have Dale Copley for 1st Tryscorer, but he scores the last 2 instead.

Newcastle vs Titans – One of the real shockers with the Knights just not showing up on arguably their biggest day of the year (NOTE – They will beat the 2013 premiers the Roosters the following week) This game was still looking sweet with Tyrone Roberts scoring in the 70th minute and looking likely as our Last Tryscorer at a decent price of 26.00. Sure enough, with a minute remaining on the clock the Knights let in a soft try and costing us another 13 unit collect. We also had 1 unit on Dave Taylor as 1st Tryscorer 2nd Half at a cool 21.00 but he scores just before, instead of just after half time. Another 21 units near-missed there.

Dragons vs Manly – Loaded up on Jason Nightingale for this match. Having him To Score 2 Tries at 9.50 and 1st Tryscorer 2nd Half at 14.50 but he misses the 1st try after half time by a fingernail. If he gets this try we land both bets and Dragons also get within 7.5 points to give us the Match Handicap bet aswell. That fingernail miss cost a total payout of 34 units across those 3 bets.

In hindsight, Week 19 was just “one of those weeks” where things just don’t quite go right and they can leave you questioning whether you’ve lost your edge. But that’s professional punting, you have those weeks now and then and you just have to pick yourself up off the canvas and get your head back in the game. I wasn’t far off in any of those games, but sometimes even when you’re on the right track you can be unlucky and lose big. With an inch of luck in just 1 of those 3 games, Week 19 becomes a break-even week at worst.

Looking more closely at the breakdown of betting across market types we have :-

 Market Type  Number of Bets  Strike Rate  Net Profit (in units)
 Match Handicap   9  11.11%  -10.63
 40 Min Handicap  12  25.00%  -19.86
 Margin Bracket  12   8.33%   -9.20
 Match/Team Points  12  41.66%   -2.62
 Points Bracket   6  16.66%  +11.60
 Halftime / Fulltime  12   0.00%  -15.50
 First Scoring Play  12  25.00%   +4.30
 Tryscorers  44  11.36%  -10.30
 Other   1   0.00%   -1.00
 TOTAL  120  15.83%  -53.21

Similarly uninspiring results, no matter which way you carve it. But it’s worth looking for trends anyway to see if there are any clues as to where things are going wrong – or right.

On the positive side, I’ve turned around recent losses on the 1st Scoring Play markets by shifting many of my bets away from the Penalty goal options that were prevalent early in the season. I’m finding some value now by taking the underdog scoring a try as the first scoring play. In a game I expect to be fairly open this option can sometimes be found at 2.50 to 3.00, when often it should be closer to an even-money shot.

The Points Bracket category is also in profit this month after landing a 0-20 points scored in the Melbourne vs Bulldogs game in Week 18 at 15.00. Overall my performance in the related Match/Team Points category is also improved. Still showing a slight loss but with a strike rate back up to 41.66% it confirms that being more selective in the points scored categories is improving my results slightly.

The Tryscorers category is showing the first loss in 3 months, however I remain confident that I still have an edge here due to an overwhelming number of near-misses this month. Quite often I would back a 1st Tryscorer and they’d get the Last Try, or score 2 tries but not the first. Variance is generally high in this category and my strike rate is down, but I’m putting it down to bad luck and some bad refereeing. Who can forget Shane Haynes on field “No Try” against David Nofoaluma for the first try in the Manly vs Wests match of Week 18. Widely touted as the worst refereeing decision of the year, that one cost us an 8.5 unit payout. Shane Hayne has had an atrocious 2 months since State of Origin started and he murdered a number of games this month, making many punters consider whether he might be on the take.

The biggest disappointment this month comes from the previously consistent 40 Min Handicap category showing a loss for the first time in months. Possibly I am over-betting and/or over-staking here as I have tried to exploit my edge of previous months. I have been frustrated by the inability this month to determine which teams are “turning up to play” and the inconsistency of teams who are not playing 80 minutes which is affecting performance in this category. There have been some wild swings in matches this month that have been particularly hard to pick. Cronulla have become an enigma and Newcastle have also become a very difficult team to read. It’s that time of the year where teams at the bottom of the ladder can be very risky to bet on or against because it’s hard to know what, or if, they will play for.

Normally big swings in matches can generate good results in the Halftime/Fulltime category though performance here is down too with a 0% strike rate for the month after consistent profit in previous months. Looking deeper into results here there was the big near-miss mentioned earlier in the Brisbane vs Warrios game in Week 19, but also 2 other games where the HT/FT flip that I often back was reversed. Sharks vs Newcastle in Week 18 and Tigers vs Bulldogs in Week 19 both had big swings after half time, but I had them the wrong way around in the HT/FT doubles.

Next month to try and hedge against some of the unpredictability I am going to wind my betting back a bit on those teams who are falling out of finals contention and have uncertain motivations. This is also this time of year where I pick out a team or two who are building form and looking likely to go all the way. Check out my Facebook and Twitter pages for all my pre-game and futures betting info.

Betting Summary June 2014 : Tough Month for NRL

JuneProfitOnly 4 weekends of NRL football were played in June, a month which was punctuated by State of Origin 2 and saw less actual matches than a normal NRL month. This has corresponded with a lower number of bets and with so many players in and out of sides and struggling with fatigue, it has been a much more varied and unpredictable month for the NRL.

As a result, June 2014 has been a tough month for NRL punting and betting performance analysis shows a moderate loss. Below is the weekly summary in table form :-

 Week  Number of Bets  Strike Rate  Net Profit (in units)
 NRL Week 13  34  14.71%  -10.12
 NRL Week 14 + Origin 2  21  4.76%  -15.50
 NRL Week 15  27  33.33%   +5.81
 NRL Week 16  33  21.21%  -2.80
 TOTAL  115  19.13%  -22.61

Overall these are pretty disappointing results. Only 1 weekend showing a modest profit and the start of the month being unusually poor. Historically I have always found the State of Origin period to be a bit tougher than usual. The standard of play in regular NRL matches does noticeably drop, as does the professionalism shown by many players. With so many team changes and injuries over the period it is difficult to analyse form lines with any consistency and it is a period where the bookies often have a distinct advantage as they usually get the inside word on player ins and outs ahead of regular betting market players – such as myself. This is compounded by the lack of information provided by mainstream media as its articles focus almost exclusively on State of Origin. For instance, in Thursdays Telegraph there are 12 articles about Rugby League and none of them even mention anything about the coming weekends matches. In many respects the NRL takes a back seat during this period and a lot of players tend to slacken off, so it is hard to tell whether a team is going to “turn up to play” on any given day. But there’s no point complaining, instead we just need to find out where things are going wrong, adapt and overcome.

Having a look across the market types for betting over the month of June gives us these results :-

 Market Type  Number of Bets  Strike Rate  Net Profit (in units)
 Match Handicap  19  21.05%  -14.49
 40 Min Handicap  9  55.55%   +4.15
 Margin Bracket  10  10.00%   -3.00
 Match/Team Points  11  36.36%   -6.66
 Points Bracket  9  0.00%   -4.75
 Halftime / Fulltime  14  21.42%   +8.50
 First Scoring Play  8  0.00%   -6.00
 Tryscorers  34  14.70%  +0.14
 Other  1  0.00%   -0.50
 TOTAL  115  19.13%  -22.61

Once again my highest strike rate and solid profit is coming from the 40 Minute Handicap category, and this month the somewhat related Halftime / Fulltime category is showing the largest net profit. This is encouraging as it suggests that I still have a reasonably good handle on which teams are likely to start matches strongly or poorly and pick up or drop off over the course of a game as a result of desperation, complacency and/or fatigue.

The Tryscorers category was also mildly encouraging, again showing a profit though only a small one this month. My biggest win for the month comes from this category landing Josh Dugan to be the First Tryscorer in the Dragons vs Melbourne game in Week 16 at a price of 15.00. Drilling a bit deeper into this category I have been getting good results backing players To Score a Try this month, but actually landed zero Last Tryscorer bets so I will need to keep an eye on that to see if there is a trend emerging.

Once again the Margin Bracket and Match/Team Points categories showed losses, though interestingly it was almost an identical performance in these categories to the month of May and it does not indicate the reversal of recent good performance lies here. I landed zero successful bets in the Points Bracket and First Scoring Play categories which is a concern, though admittedly the sample size this month is small and these are usually options I take at longer odds so I do expect a low strike rate here.

The biggest concern is the turnaround in the Match Handicap category where my strike rate dropped from 45.45% in May down to 21.05% in June. This reversal saw a +17.22 unit profit drop to a -14.49 unit loss and is undoubtedly where my largest problem this month lies. Looking deeper into this category I can see that much of the losses here are from giving away larger handicaps at bigger odds, which fits with my earlier assessment of players showing fatigue and lacking professionalism at this point in the season – basically teams are getting ahead and then “cruising” or not going on to score the bigger victories that were more common early in the season. This tells me that I might need to pull back from betting on those big blow-out scorelines during the origin period.

For any more detailed analysis of my betting performance in June, feel free to check out my Facebook Page where all of my bets have been posted prior to kickoff. Or, if you would like to ask any specific questions about my June betting, please write to me at phantomlongshot@flameburst.com
Betting Summary May 2014 : Consistent Weekly Profit

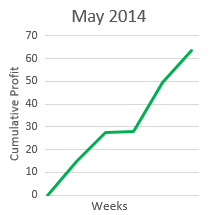
MayProfitThe reviewing of betting performance is an important part of professional punting because trends can be identified where particular sports or market types may become more or less profitable over time. It is important to constantly adapt and evolve betting strategies over time to stay competitive and this is not really possible without reviewing recent performance.

May 2014 has been a solid month with consistent weekly profits generated. Below is the weekly summary in table form :-

 Week  Number of Bets  Strike Rate  Net Profit (in units)
 Rep Weekend  9  55.55%  +14.55
 NRL Week 9  28  32.14%  +13.10
 NRL Week 10  41  24.39%   +0.48
 NRL Week 11 + Origin 1  35  25.71%  +21.27
 NRL Week 12  27  33.33%  +14.22
 TOTAL  140  30.00%  +63.62

Overall these are fairly satisfactory results. The Representative Weekend was a bit of a statistical anomaly because of fewer games being played and fewer bets placed, so it can be discounted to some extent. Interestingly the 2 weeks with the higher number of bets also show the lower strike rate, suggesting those weeks had more bets placed at longer odds. The vast difference in profit for those 2 weeks would also be consistent with the higher variance on good price options.

Having a look across the market types for betting over the month of May gives us these results :-

 Market Type  Number of Bets  Strike Rate  Net Profit (in units)
 Match Handicap  22  45.45%  +17.22
 40 Min Handicap  16  62.50%   +8.43
 Margin Bracket  9  11.11%   -3.00
 Match/Team Points  19  42.10%   -6.08
 Points Bracket  8  12.50%   +6.75
 Halftime / Fulltime  17  11.76%   +2.50
 First Scoring Play  9  22.22%   +3.40
 Tryscorers  40  20.00%  +34.40
 TOTAL  140  30.00%  +63.62

Here the analysis becomes a bit more interesting. A good portion of my monthly profit for May has come from the Tryscorer bets and the Match and 40 minute Handicap bets. My strike rate is very good in particular when handicap betting on only one half of football (62.5%) though the profit on that market category is only fair since generally the prices obtained in this market category are only around the 1.90 mark. The Tryscorer betting, on the other hand, is often at much longer odds. My biggest individual wins of the month came from the Tryscorer category with a bet on Ben Matulino to be First Tryscorer in the Warriors vs Canberra game in Week 11 at a price of 41.00. Also I had a good win from having Jamie Soward to be the Last Tryscorer in the Penrith vs Parramatta game in Week 12 at a price of 26.00.

The Margin Bracket category was disappointing. It includes the 1-12 Margin bets, the 1-6 Tribet option and the Draw options. Here I was let down by the frequent Halftime Draw bets placed, though I had great success in this category early in the year so I am not too concerned. I’m more concerned about the Match / Team Points result, where a decent strike rate of 42.1% still gave me a net loss. This is another category where odds taken are frequently around the 1.90 mark. I have found in the past that this can be a tough category as it is very frequently affected by the weather and also by the refereeing. Some referees will blow a penalty-a-minute (results in high scoring), while others will allow defenders to encroach the 10 metre mark and stifle opposition attacks (results in low scoring). I take some heart from the good result in the related Points Bracket category where I make up for those losses. Here I have a much lower strike rate at 12.5% but am showing a profit from hitting an 11-20 Total Points bracket at 26.00 in the Souths vs Sharks game in Week 11. What I can see here is that I need to be more careful taking those shorter odds on Points markets.

A couple of other things I’ve noted from the May betting performance is that I am not reading a couple of teams very well. In particular the Sydney Roosters I have gone 3 weeks running without landing a single winning bet on their matches. That is 0 wins out of 17 bets placed on Roosters matches over 3 weeks. Clearly I am having difficulty with the Roosters inconsistency in effort where they are definitely a class side but don’t always play to their potential. The other team I had been struggling to read a bit in the past is the Brisbane Broncos, but I am starting to get a handle on their spine combinations now and I have turned around recent poor betting on the Broncos with a solid win in their Manly game. That’s the way it goes sometimes when a team can become inconsistent and hard to read it is often a good idea to reduce stakes or stay away from them until I am seeing them a bit clearer.

For any more detailed analysis of my betting performance in May, feel free to check out my Facebook Page where all of my bets have been posted prior to kickoff. Or, if you would like to ask any specific questions about my May betting, please write to me at phantomlongshot@flameburst.com